9卷/3期

9卷/3期

華藝線上圖書館

Pages:

1-8

論文名稱

利用二維房屋圖資及立體影像自動重建房屋外圍輪廓

Title

Automatic Building Outline Reconstruction Using 2D Building Data and Stereo Images

作者

邵怡誠;陳良健

Author

Yi-Chen Shao;Liang-Chien Chen

中文摘要

本文利用既有的二維房屋圖資及航照立體影像對為材料,自動重建屋頂外圍的三維輪廓,但未考慮屋頂面上的附加物。重建房屋外圍輪廓的資料,主要是從航照立體影像對上獲取,但因航照影像資料內容極為豐富龐雜,不易明確萃取所需資訊,故採用既有的二維房屋圖資以為輔助及約制。文中處理程式主要有五,第一先以Canny偵測元產生邊線像元的梯度影像;第二利用既有房屋的二維圖資,設定各側屋簷線在影像空間及物空間的工作區;第三是在影像工作區中利用灰階霍夫轉換偵測直線段;第四是依核線幾何交會出三維線段,且僅保留物空間工作區內的3D候選線段;第五是依所設計的最短連接規則,連接適當的線段以完成房屋輪廓。實驗成果顯示,在兩組航照影像中,對六棟平頂屋及九棟山形屋的重建成果,除一棟山形屋失敗外,其餘各棟之屋角座標相對於人工量測者之精度評估,平面之均方根誤差為0.6lm、高程之均方根差為0.86m。

Abstract

In this paper, we propose a method to automatically reconstruct building outline using 2D building data and stereo images. We focus on the outline of building without inclusion of the inner structure of the roof surface. Five procedures are integrated: 1) the production of the magnitude image of edge pixels, 2) locating the working space on image by 2D building data, 3) detection of line segments using grayscale Hough Transform, 4) obtaining the candidates of 3D line segment by epipolar geometric constraint, and 5) generation of the building outline from candidates. For accuracy assessment, we compared the reconstructed building out line with the manual measurement at corners of 14 buildings. The RMSEs of planmetric position and elevation is 0.61m and 0.87m, respectively. The experimental results show that this method may be applicable to those buildings with plane roof or gable roof.

關鍵字

房屋重建,Canny偵測元,霍夫轉換

Keywords

Building Reconstruction,Canny Detector,Hough Transform

附件檔名

華芸線上圖書館

N / A

備註說明

200409-9-3-1-8

Pages:

9-14

論文名稱

應用雷達差分干涉法監測都會型地表變形:以中壢工業區爲例

Title

Application of DInSAR in Monitoring the Metropolitan Land-Surface Deformation: Jungli Industry Park as an Example

作者

張中白;王志添;王皓正;陳錕山

Author

Chung-Pai Chang;Chih-Tien Wang;Hao-Cheng Wang;Kun-Shan Chen

中文摘要

本研究選用八幅ERS1/2人造衛星所擷取的合成孔徑雷達影像,以差分干涉法進行測量,成功獲得中壢工業區過去十年內地表變形情形。研究成果顯示中壢工業區的變形以垂直下陷為主,變形區域大體呈圓形分佈。另外,本區下陷事件大約從1996年開始發生,至2000年以後方才逐漸趨緩;由於明顯的下陷速率變化,以及近圓形的變形分佈,本區的地層下陷極有可能是地下水抽取所引起。地下水抽取造成的地層下陷可以利用數值模擬加以驗證,這將是後續的研究重點。

Abstract

Eight ERS1/2-SAR images recorded in the last ten years are used for determining the land-surface deformation in the Jungli Industry Park area by differential interferometric method. The interferometric results reveal a circular-shape subsidence of which the center is situated within the Jungli Industry Park center. Moreover, the subsidence event of this area occurred from 1996, and tended to cease after 2000. The rapid change of subsidence rate and the circular-shape of subsidence distribution illustrate that the artificial influences, for example, groundwater pumping may be important factors for the land subsidence of the Jungli area. Numerical simulation of land subsidence in terms of discharge/recharge of groundwater can substantiate in advance the relationship between the land deformation and the groundwater influence for the Jungli area in the future.

關鍵字

合成孔逕雷達,差分干涉法,地表變形

Keywords

Synthetic Aperture Radar,Differential Interferometry,Land-Surface Deformation

附件檔名

華芸線上圖書館

N / A

備註說明

200409-9-3-9-14

Pages:

15-30

論文名稱

一個用以改正SPOT衛星資料大氣效應之模式

Title

A Model to Correct the Atmospheric Effect for SPOT/HRV Bands

作者

劉建慧

Author

Chien-Hui Liu

中文摘要

本文針對SPOT衛星影像提出一簡易大氣改正模式(SACM)。氣體吸收及雷式光學厚度使用解析函數簡化之。雷式光學厚度及氣溶膠散射之決定使用查閱表。結果顯示大氣函數與方位角之相關必須考慮之,雖然ATCOR2及ATCOR3(Richter,1997)已簡化之。SACM不僅準確模擬大氣層頂反射率,且速度較6S模式快。 SACM之反向應用顯示,若改正周圍效應之後,所反演之地表反射率之相對誤差,即使在混濁大氣時也能大為減少。文中也提出模式將來改進之處。

Abstract

A simple atmospheric correction model (SACM) for SPOT satellite images is presented. Gaseous transmission and Rayleigh optical depth are simplified as analytic functions. Rayleigh and aerosol scattering are determined using lookup tables. Results indicate that dependence of atmospheric functions on azimuthal angle should be considered, although ATCOR2 and ATCOR3 developed by Richter (1997) simplify the dependence. SACM not only quite accurately simulate top-of-atmosphere reflectance, but also does so faster than 6S developed by Vermote et al.(1997). The results of the inverse application of SACM also indicate that the relative error of surface reflectance can be greatly reduced even in hazy sky if the adjacency effect is corrected. Future possible improvements are also highlighted.

關鍵字

SPOT,大氣改正模式,週圍效應

Keywords

SPOT,atmospheric correction model,adjacency effect

附件檔名

華芸線上圖書館

N / A

備註說明

200409-9-3-15-30

Pages:

31-80

論文名稱

A Review of Polarimetric SAR Algorithms and Their Applications

Title

A Review of Polarimetric SAR Algorithms and Their Applications

作者

Jong-Sen Lee;Wolfgang-Martin Boermer;Dale L. Schuler;Thomas L. Ainsworth;Irena Hajnsek;Kostas P. Papathanassiou;Ernst Lüneburg

Author

Jong-Sen Lee;Wolfgang-Martin Boermer;Dale L. Schuler;Thomas L. Ainsworth;Irena Hajnsek;Kostas P. Papathanassiou;Ernst Lüneburg

中文摘要

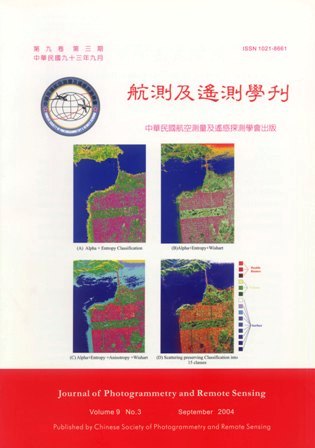
In this paper, we provide a review of polarimetric synthetic aperture radar applications and analytical algorithms that are necessary tools for these applications. We first introduce coherent polarimetric optimization algorithms, then some for the partially coherent case, compare three frequently applied target matrix decomposition algorithms, and show their major differences. Topics of polarization orientation angle estimation and speckle filtering are also discussed and illustrated with examples. The important applications of terrain and land-use classification are described from the concept of the maximum likelihood classifier based on the Wishart distribution. In addition, recently developed techniques focused on soil moisture, surface roughness, polarimetric SAR interferometry and SAR tomography are outlined. Most of the topics discussed are interrelated, and these comparative assessments are discussed throughout this paper
Abstract

In this paper, we provide a review of polarimetric synthetic aperture radar applications and analytical algorithms that are necessary tools for these applications. We first introduce coherent polarimetric optimization algorithms, then some for the partially coherent case, compare three frequently applied target matrix decomposition algorithms, and show their major differences. Topics of polarization orientation angle estimation and speckle filtering are also discussed and illustrated with examples. The important applications of terrain and land-use classification are described from the concept of the maximum likelihood classifier based on the Wishart distribution. In addition, recently developed techniques focused on soil moisture, surface roughness, polarimetric SAR interferometry and SAR tomography are outlined. Most of the topics discussed are interrelated, and these comparative assessments are discussed throughout this paper

關鍵字

Keywords

附件檔名

華芸線上圖書館

N / A

備註說明

200409-9-3-31-80

Pages:

81-96

論文名稱

「科技短文」高光譜影像視覺化及其分析

Title

Visualization of Hyperspectral Images for Spectral Analysis

作者

徐百輝;曾義星

Author

Pai-Hui Hsu;Yi-Hsing Tseng

中文摘要

資料分析的主要目的在於歸納、詮釋及描述資料之內涵,並凸顯出某些重要的特徵,例如欲降低高維度資料之維度時,必須先分析不同類別資料的分佈特性,此時資料的視覺化將扮演一個重要的角色。本文利用各種不同的視覺化技術來檢視與分析高光譜影像,其中資料投影為最常用的視覺化方法之一,其基本原理係將高維度資料投影至人眼可辨識的二維空間中,其結果將有助於我們保存重要的資料結構,並萃取出感興趣之資料特徵。另外,高光譜影像之二階統計量亦可以利用虛擬色彩表示成所謂的統計量影像。此外,本文亦採用多尺度分析方法,如尺度空間法及小波分析法,於時頻空間中顯示高光譜影像的吸收特徵。這些視覺化方法都將有助於我們探索整個資料集,未來並可針對不同的應用,如資料表示、影像分類及影像壓縮等萃取出相對應的有用特徵。

Abstract

Some visualization techniques are used to analyzing and exploring the data set of hyperspectral images. The major objectives of data analysis are to summarize and interpret a data set, describing the contents and exposing important features. For dimensionality reduction of hyperspectral images, visualization can play an important role in illustrating the characteristics of high-dimensional data set. Data projection is one of the common visual ways to get the interesting subsets of the original data, and certain properties of the structures can be preserved as faithfully as possible. An effective visualization tool called statistics images displays the second-order statistics of hyperspectral images as a pseudo colored maps. In addition, the multi-scale approaches such as scale space and wavelet analysis are used to visualize the hyperspectral curve in a time-scale plane. These techniques of visualizations will help us to explore the whole data set and extract useful features for further applications such as data representation classification and compression in the future.

關鍵字

高光譜影像,視覺化,光譜分析

Keywords

Hyperspectral Images,Visualization,Spectral Analysis

附件檔名

華芸線上圖書館

N / A

備註說明

200409-9-3-81-96

Pages:

97-108

論文名稱

「科技短文」VCDi機載遙測系統綠光波段取像測試

Title

System-level Test of VCDi Air-borne Sensor Band 2 Image Module

作者

林修國;蔡和霖;蘇方旋;黃鼎名

Author

Shiou-Gwo Lin;Ho-Lin Tsay;Fang-Hsuan Su;Ting-Ming Huang

中文摘要

VCDi是精儀中心自行設計組裝測試之機載多光譜光學遙測取像系統。此系統之綠光波段(B2)於91年4月進行機載取像測試。精儀中心針對此遙測系統發展出一系列測試流程。其中兩個主要項目為輻射度校正與幾何校正參數的量測。本文介紹這兩個測試項目的實驗架構與測試結果,最後以正射影像評估其影像精度,以中央l個及外圍5個點位為控制點進行座標轉換,得到控制點的RMS為0.51像元(換算地表的精度約為25.7公分),另以其餘8個點位為檢核點得到X軸的RMS為0.74像元(37.5公分),Y軸的RMS為0.45像元(22.6公分)。

Abstract

VCDi is an air-borne multi-spectral remote-sensing imager. Design, development, and test of this system are performed in precision instrument development center (PIDC). Air-borne functional test for this system was carried out on one of the four multi-spectral bands in April 2002. Test flow and test setup are built for this system in PIDC. Two of the main items in system-level tests, radiometric calibration and geometric parameters measurement were introduced in this article. The image accuracy is evaluated by comparing air-born orthographic image with ground control points. Pairs of image and ground coordinate at five boundary points and one central point are used as controls to estimate transformation coefficients, the estimated residual is 0.51 pixel (around 25.7 cm on ground). At 8 check points, RMS is 0.74 pixel (37.5cm) on X-axis and 0.45 pixel on Y-axis (22.6cm).

關鍵字

輻射度校正,幾何校正,正射影像

Keywords

radiometric calibration,genmetric calibration,orthographic image

附件檔名

華芸線上圖書館

N / A

備註說明

200409-9-3-97-108

更多活動學刊